See why the global automotive industry is demanding lightweight technology, and how Carbon Revolution is scaling up to meet the demand for its OEM carbon fibre wheels.
As the world shifts to electric vehicles, Carbon Revolution’s lightweight carbon fibre wheel technology is increasingly sought-after by global carmakers.
Carbon Revolution has been awarded OEM wheel programs for electric vehicles, with additional programs in the design and engineering phase.
As the only company producing OEM carbon fibre wheels at scale, Carbon Revolution is well ahead of competitors.
Increased demand for step change technology.
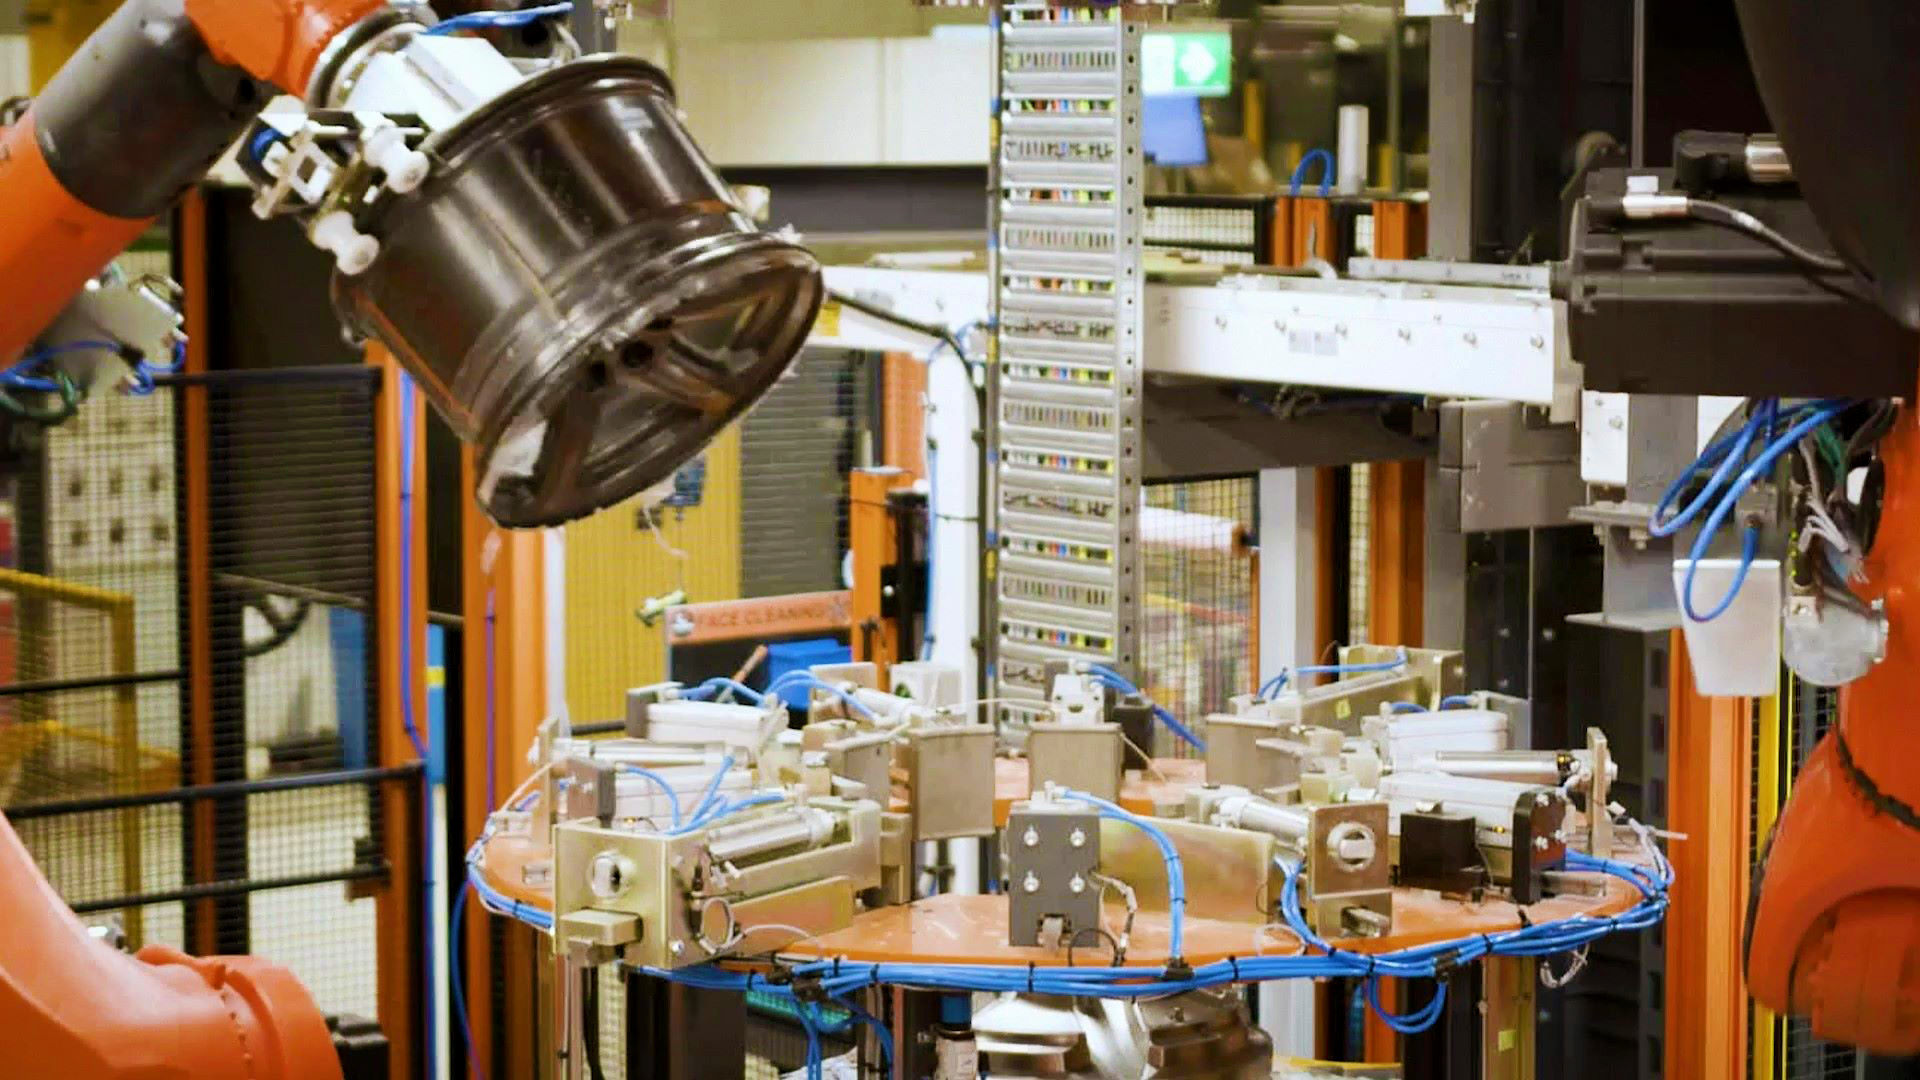
To work to achieve disruption and meet increased customer demand, Carbon Revolution has scaled up its operation and further automated its facilities. The first Mega-line kicks off a step change in carbon fibre wheel production capacity and efficiency.
Carbon Revolution CEO, Jake Dingle, said the Company plans to further increase its production capacity.
“The intention was always to disrupt the global automotive industry with this significant step-change lightweight wheel technology. We never set out to be a niche player.
We’ll need to keep scaling up in the coming years and the growing and increasing demand from our customers means that we’ll need access to more capital to expand further. That’s why we’re listing in the US, so we can expand faster, and supply carbon fibre wheels at much higher volumes.”
Find out more about Carbon Revolution’s proposed merger and US listing.
Projection Methodologies
Basis of preparation
This video contains the Company’s estimates of projected Revenue from future wheel sales for the calendar years 2023 and 2024 (the “Financial Projections”). The Company’s independent auditors have not audited, reviewed, compiled or performed any procedures with respect to the Financial Projections, and accordingly, they did not express an opinion, and did not and do not provide any other form of assurance with respect thereto and assume no responsibility and disclaim any association for the purpose of this presentation. These Financial Projections should not be relied upon as being necessarily indicative of future results.
The Financial Projections have been prepared by the Company as part of its long-range planning process and are included in this document to provide current and potential investors with information to assist them in understanding the Company’s forecast financial performance, for their use in evaluating the transaction described in this video.
The Directors of the Company are responsible for the preparation and presentation of the Financial Projections. The Directors of the Company consider that the Financial Projections provide a reasonable basis for current and potential investors to assess the Company’s forecast financial performance, in the context of the Assumptions, Risks and Sensitivities outlined below. Inclusion of the Financial Projections should not be regarded as a representation by any person that the results contained in the Financial Projections will be achieved.
The Financial Projections are presented in an abbreviated form and do not include all of the statements, disclosures or comparative information required by US Generally Accepted Accounting Principles or Australian Accounting Standards.
Assumptions
The Financial Projections have been prepared on a detailed, bottom-up basis. The assumptions applied in relation to each key component of the Financial Projections are as follows:
- Program overview: The revenue projections have been prepared on a program-by-program basis. The Company has a number of programs at various stages of production and development, as follows:
- Awarded Production: The Company currently has 11 active awarded programs with 4 global OEMs (6 of which are currently in production and 5 of which are under development).
- Awarded Design & Engineering: The Company also has 3 programs that are under detailed design and engineering agreements signed with OEMs to allow Carbon Revolution to initiate work on the detailed program specific design and engineering phase. Engineering occurs after the Company has been selected to be on a platform launching generally within 3 years and is the final stage before a formal award (only one party is brought into engineering). The Company has in all but one instance been awarded a platform post-engineering that was ultimately produced by the OEM.
- Pipeline: The Company also has a number of prospective OEM wheel programs in its business development pipeline. Management has reviewed the current pipeline of programs and identified three programs which it expects to be secured and convert to production during 2023 and 2024, taking into account the status of current discussions with the OEMs and expected ramp-up profiles.
- Overall, the Financial Projections assume an increase in the number of programs in production, to 11 programs by December 2024. It is the Company’s expectation that all of the contracts currently under Design & Engineering will convert to production, together with a further three projects currently in the pipeline (refer below)
- Volumes: The Company has undertaken a detailed assessment of expected wheel volumes on a program-by-program basis, taking into account contractual arrangements and the latest correspondence with respective to OEMs for both Awarded and Pipeline projects. Whilst the Company’s contracts with OEMs do not provide contractual or minimum volume guarantees, the Company is in regular dialogue with OEMs in relation to OEMs’ production forecasts, which provides a degree of visibility over future volumes (particularly in the short-term). This correspondence with OEMs forms the primary basis of the volume projections for awarded and near-term pipeline projects, supplemented (where relevant) by other sources of information (e.g. market data, production capacity requests from OEMs, take rate indications, management expectations of volumes based on experience and market knowledge). Overall wheel volumes are projected to increase from 13,883 in CY22 to 47,839 in CY24 driven by the ramp-up in production on awarded and pipeline programs, with 11 programs assumed to be in production by December 2024.
The Financial Projections also assume that the latest production schedules received from OEMs are accurate, assuming no unforeseen delays (e.g. from COVID-19, semi-conductor shortages or other supply chain challenges).
- Pricing: Pricing is projected on a program-by-program basis, taking into account contracted amounts for awarded programs and tendered amounts for pipeline programs. The Company is currently in discussions with all customers in relation to potential price increases in light of input cost inflation. The Financial Projections assume current pricing continues throughout CY23 and CY24, i.e., does not assume any price changes.
- Raw materials, freight and other direct manufacturing costs: The Company has projected raw material costs for each wheel program. In doing so, it has considered expected product designs and material composition, production process usage, scrap and waste, raw material pricing and inflation, expected volume-based negotiation benefits, productivity-based improvements and expected inbound and outbound freight and logistics costs. Overall, the Financial Projections assume a reduction in direct material costs per wheel of 23% between CY22 and CY24, with cost efficiencies projected to more than offset recent input cost inflation. The Company has not incorporated any further cost inflation (e.g. as a result of the current Ukraine/Russia war) in its projected raw material or supply chain costs as it is assumed this can be passed through to customers.
- Direct labour: Direct labour is projected based on the Company’s detailed process-by-process operational model. The Financial Projections assume significant improvements in direct labour productivity, with direct labour per wheel decreasing by approximately 48% between CY22 and CY24. This is based on a range of factors including targeted improvement to product and process quality, expected scale-based volume efficiencies, reduced wastage, manufacturing technology and operational improvements and the introduction and commissioning of significant plant automation (including the Mega-line, which is assumed to be commissioned from Q1-CY23 onwards).
- Research and development (“R&D”): R&D costs, which primarily comprise salaries (for staff involved in R&D) and material costs (e.g., wheel moulds) have been projected based on current run rates together with management’s expectation of additional R&D investment to support current and future programs. The Financial Projections assume that certain R&D costs can be capitalised under accounting standards. R&D R&D costs…are projected to increase from USD$3.2 million (subsequently revised to $10.4 million in connection with the restatement of financial statements, as described in footnote 1 to the table below) in CY22 to USD$4.5 million in CY24 (a decrease of $5.9 million from the restated amount in CY22) .
- Selling, General and Administrative (“SG&A”) costs: These costs are projected on a detailed item-by-item basis, taking into account current run rate expenditure, anticipated cost inflation, increases in variable costs to reflect wheel volume growth (e.g. scrap, warranties) and other incremental spend (e.g. additional headcount to support growth). These costs are projected to increase from USD$19.8 million in CY22 to USD$26.2 million in CY24, including additional headcount to support growth. Ongoing costs arising from listing in the United States are assumed to be materially consistent with those listing costs in Australia. Costs related to new employee incentive plans are assumed to be materially consistent with the cost of such plans in Australia.
- Ongoing costs arising from listing in the United States are assumed to be materially consistent with listing costs in Australia. Costs related to new employee incentive plans are assumed to be materially consistent with the cost of such plans in Australia.
- Grant income: The Financial Projections assume a level of income from Australian-based government grants, based on specific grants announced by the respective governments. These equate to US$1.6 million in CY23 and US$2.1 million in CY24.
- Transaction costs: EBITDA does not include any transaction costs or other one-off type costs
- FX: The Financial Projections have been prepared in Australian Dollars (being the Company’s functional currency) and converted to US Dollars at a rate of 0.70:1 (USD:AUD). The Company does not undertake any hedging activities.
Key Risks (Financial Projections)
The following items represent the key risks contained within the Financial Projections. This list is not considered exhaustive and should be considered in the context of the Risks outlined in the Risk Factors section of this report.
- Volumes: Awarded wheel programs may experience delays in development or production, or wheel production volume increases may not be as expected.
- New programs: Future wheel programs may not be awarded, or may not be awarded in the expected timeframe or to the expected volumes.
- Pricing: The price received by the Company for its wheels may be different from expectations. Similarly, the Company may not recover engineering and development or tooling costs from its customers to the extent expected.
- Materials: Direct Materials costs may be higher than assumed in the Financial Projections, e.g. if the projected operational improvements or procurement savings do not materialise in the timeframe anticipated, or if underlying input cost inflation is greater than projected.
- Labour: Direct Labour costs may be higher than assumed in the Financial Projections, e.g. if the projected operational improvements (including Mega-line) do not materialise in the timeframe anticipated. Overheads: SG&A and R&D spend may be higher than assumed in the Financial Projections.
- FX: Foreign exchange rates could adversely impact the Company’s financial performance (notably a weaker Australian Dollar than assumed in the Financial Projections).
Sensitivities
The Financial Projections are based on a number of estimates and assumptions, as described above. These estimates and assumptions are inherently uncertain and are subject to business, economic, market and financial conditions, competitive uncertainties and contingencies and other matters, many of which are beyond the control of the Company, and based on assumptions with respect to future business decisions, which are subject to change. Accordingly, there can be no assurance that the Financial Projections are indicative of the future performance of the Company or that actual results will not differ materially from those presented in the Financial Projections. The Financial Projections are also subject to a number of risks including those outlined above. Investors should be aware that future events cannot be predicted with certainty and as a result, deviations from the amounts projected are to be expected. To assist investors in assessing the impact of these assumptions on the Financial Projections, the sensitivity of the projected revenue (US$90.1 million) and EBITDA ($2.8 million) in CY24 is set out below. The changes in key variables set out in the sensitivity analysis are not intended to be indicative of the complete range of variations that may be experienced.
Care should be taken in interpreting these sensitivities. In order to illustrate the likely impact on the Financial Projections, the estimated impact of changes in each of the assumptions has been calculated in isolation from changes in other assumptions. In practice, changes in assumptions may offset each other or be additive, and it is likely that the Company would respond to any changes in one item to seek to minimise the net effect on the Company’s earnings and cash flow.
The sensitivity analysis set out below is intended to provide a guide only and variations in actual performance could exceed the ranges shown, and these variances may be substantial. For example, the Financial Projections are premised on a significant increase in sales volume, particularly driven by the commencement of new programs and it is possible that the rate of increase in sales volumes from new programs does not increase at the rate projected in the financial year.
- Change in FX rate (USD:AUD)
The Financial Projections are based on a USD:AUD rate of 0.70:1. Management estimates every $0.01c movement in the USD:AUD rate changes revenue by US$1.3 million, but with minimal impact on EBITDA. If this rate were to remain at 0.67:1 (being the rate as at 7 March 2023), this would reduce CY24 revenue by US$3.9 million and CY24 EBITDA by US$0.1 million.
- Sales volumes
If CY24 wheel volumes were 10% greater than/ lower than projected, this would impact revenue and EBITDA as follows: i) Revenue+/- US$8.8 million; ii) EBITDA + / – US$2.7 million.
- Timing delays/ volume slippage
As discussed above, the Financial Projections reflect management’s estimate of volumes, taking into account OEM’s production forecasts and assuming no delays in securing contracts or commencing production. In the event of a 1-month timing delay on all new programs which have not yet entered production, this would reduce CY24 revenue by US$4.9 million and EBITDA by US$1.7 million.
- Average price per wheel
If sales prices were 2% greater than/ lower than projected, this would increase/ reduce CY24 revenue and EBITDA by US$1.8 million.
- Direct materials
The Financial Projections assume that the Company generates significant direct material savings (e.g. through operational improvements, procurement; design and technology) to more than offset underlying cost inflation. If Direct Material costs per wheel were 10% higher than projected, this would reduce CY24 EBITDA by $3.2 million.
- Direct labour
The Financial Projections assume a step-change improvement in direct labour productivity from Q2-CY23 onwards, driven by efficiency improvements (including the commissioning of the Mega-line) and volume growth. If direct labour costs per wheel were 10% higher than projected, this would reduce CY24 EBITDA by US$2.6 million.
- Overheads and R&D
If the expensed portion of SG&A and R&D were 5% greater than projected in CY24, this would reduce EBITDA by US$1.4 million.


